

Top Daily Reports
- Sales Reports – How much are you making? What’s being refunded?
- Customer Reports – Who’s buying? Where are they from?
- Product Reports – What’s hot and what’s not?
- Acquisition Reports – Where is traffic coming from? Ads? Google?
- Behavior Reports – What do people do when they visit your store?
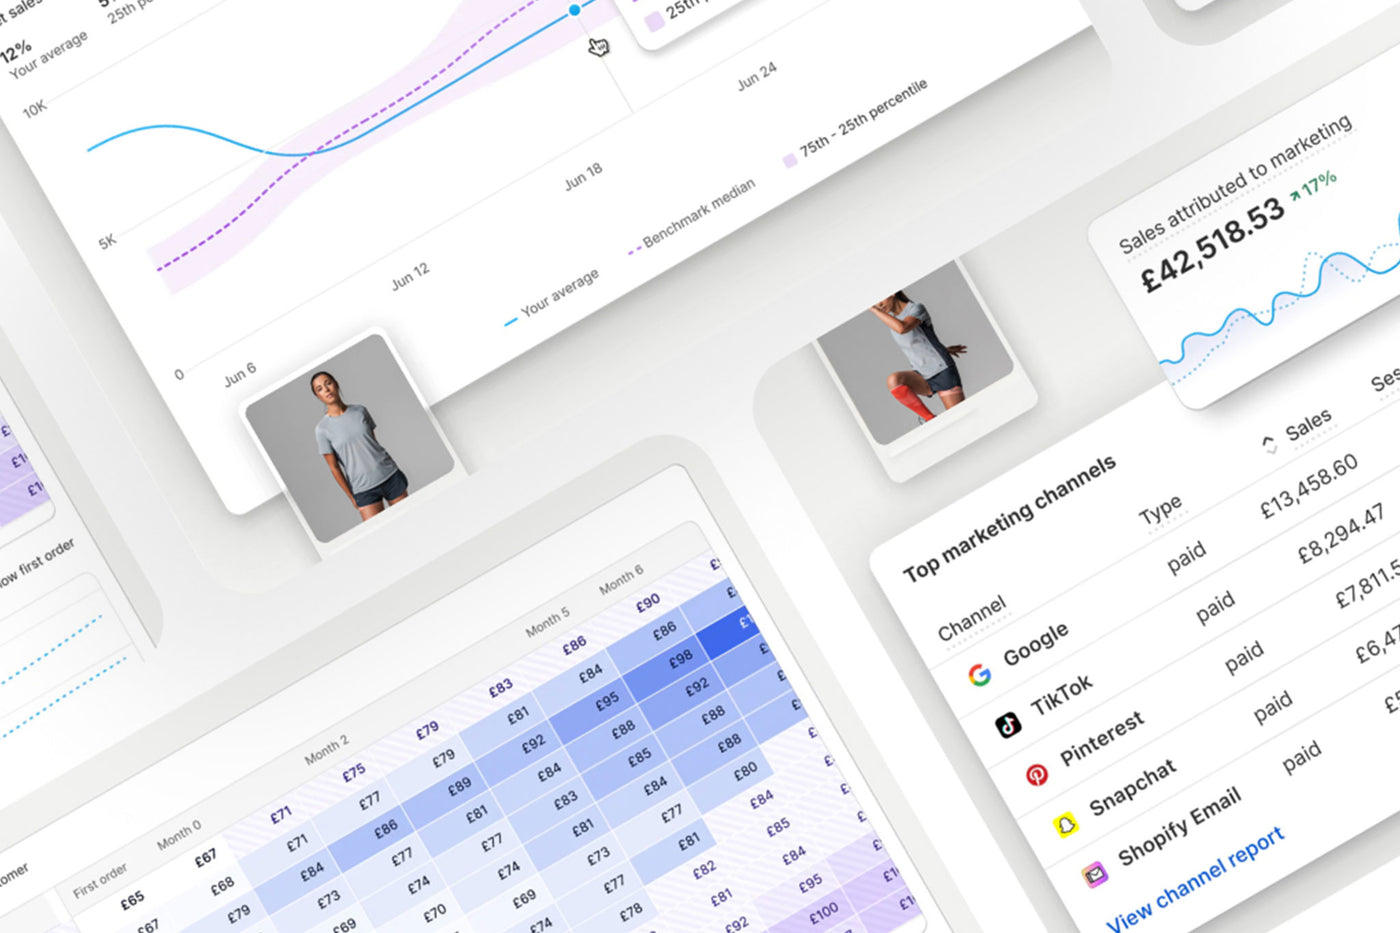
Your Analytics Dashboard
Here’s what you see:
- Total Sales
- Sessions (aka visits)
- Conversion Rate
- Average Order Value (AOV)
- Top Products & Pages
Track it. Measure it. Improve it.
Shopify Live View
Wanna feel the thrill? Watch people shop live on your store:
- Real-time visitor activity
- Where they’re from
- If they’re adding to cart, checking out, or bouncing
Perfect for drops, promos, or new product launches!

If You’re on Advanced Plan
- Make custom reports (filter by product, region, device)
- Export to CSV
- Play with the data in Google Sheets or Excel
Tools That’ll Make Life Easier
- Google Analytics 4 – For deep tracking
- Ubersuggest – Keyword + traffic analysis
- Better Reports – Pretty charts + custom metrics
- Lifetimely – LTV, retention, cohort analysis
Pro Tips
- Set clear goals (like 2% conversion rate or $100 AOV)
- Use date filters to see trends
- Compare this month vs last month
- Export reports and look for patterns
- Always optimize based on data, not gut feeling
Key Takeaway
If you’re not using Shopify Analytics, you’re guessing. Don’t guess. Numbers don’t lie. Dive into your data, spot the trends, double down on what works.

